
On this page
Standardise the test before celebrating a record. Keep maximum force, early force and measurement uncertainty separate, and do not assume an instrument’s decimal places describe its accuracy.
Changing leverage changes the question
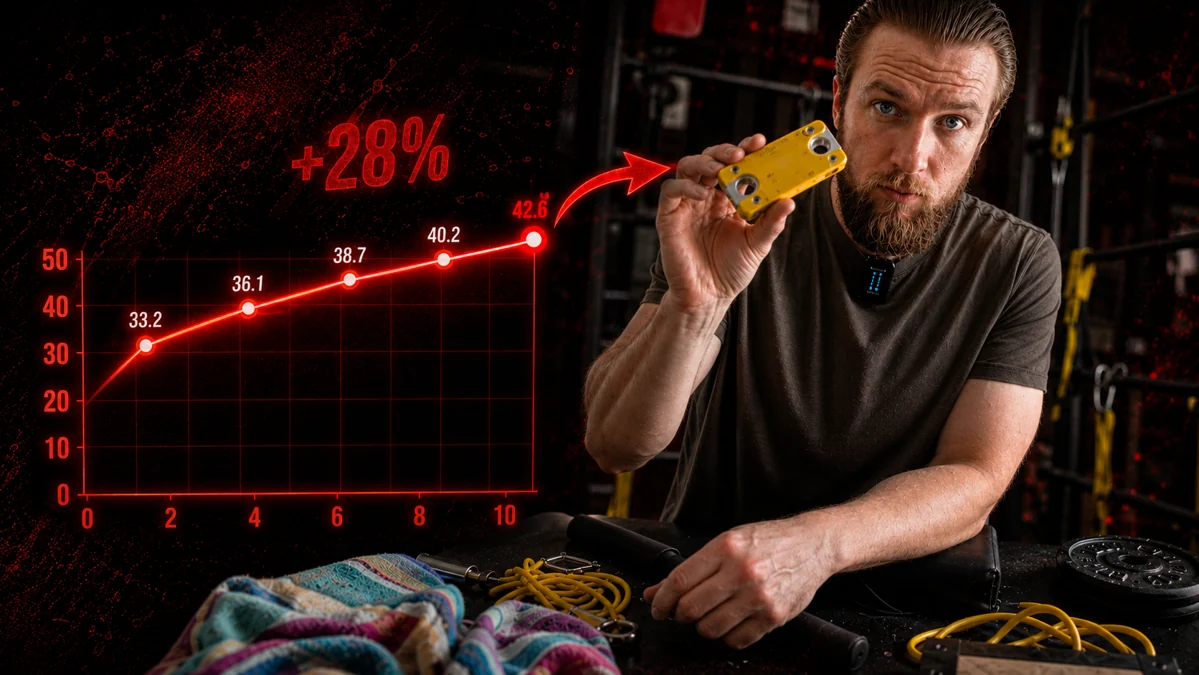
A different wrist position, attachment point or elbow angle can alter the mechanical demand of a lift. A cable stack label is also not a universal measure of force at the hand: pulley ratios and friction affect the relationship. The video correctly warns that a heavier load with an easier setup is not a clean before-and-after comparison. Record the setup, chain length, attachment, posture and allowed movement. A technique change may be valuable, but it should be labelled as a different task rather than hidden inside a strength record. [1, 2]
Isometric means the intended position is maintained
A hold that gives way is not the same test as force against an immovable fixture. If a joint moves while the athlete is trying to resist the load, the measured peak may include a different contraction condition. Similarly, a dynamic one-repetition maximum is not automatically interchangeable with maximum voluntary isometric force when calculating a training percentage. Choose a definition that can be repeated, film the position when useful, and avoid claiming laboratory precision merely because the displayed value has a decimal. [2]
Sampling frequency determines the gap between observations
| Sampling frequency | Interval between samples |
|---|---|
| 80 Hz | 12.5 |
| 200 Hz | 5.0 |
| 500 Hz | 2.0 |
| 1000 Hz | 1.0 |
interval_ms = 1000/frequency_Hz
Sampling matters most near the start
The interval between samples is 1,000 divided by sampling frequency when expressed in milliseconds. At 80 Hz it is 12.5 ms; at 500 Hz it is 2 ms. That arithmetic helps explain why early-force analysis is sensitive to device limitations. Sampling frequency alone still cannot establish validity: calibration, fixture compliance, onset detection, filtering and starting tension all matter. The comparison is about generic sampling rates, not a verified specification or endorsement of a currently sold device. [2]
Look for changes larger than ordinary variability
In one armwrestling-specific study, maximum-force variables had ICC values of 0.916–0.971 and RFD variables 0.681–0.892. Those coefficients describe relative reliability within that protocol; they do not mean that your device is accurate to a corresponding percentage. Repeated baseline sessions help reveal personal variability. Track maximum force and selected time points with consistent instructions, and interpret small changes cautiously. Using the same imperfect device every week can reduce some inconsistency, but it does not automatically remove systematic error. [1, 2]
What this does not tell us
No universal smallest meaningful change can be calculated from the supplied material. The wrist-curl PDF contains printed checkpoints but no raw CSV archive, so the site does not claim an independent raw-signal reanalysis.
Source materials
Isometric wrist curl: measured checkpointsPDF in English · 3 pagesReferences
Based on the supplied English video transcript and the sources below.
- Lakićević M, Dopsaj M, Marković S, Matić M, Klisarić D. (2021). Reliability of specific tests of strength of sports arm wrestling. Facta Universitatis, Series: Physical Education and Sport. 19(1):97–107.
- Maffiuletti NA, Aagaard P, Blazevich AJ, Folland J, Tillin N, Duchateau J. (2016). Rate of force development: physiological and methodological considerations. European Journal of Applied Physiology. 116:1091–1116.